By: Taylor Justason
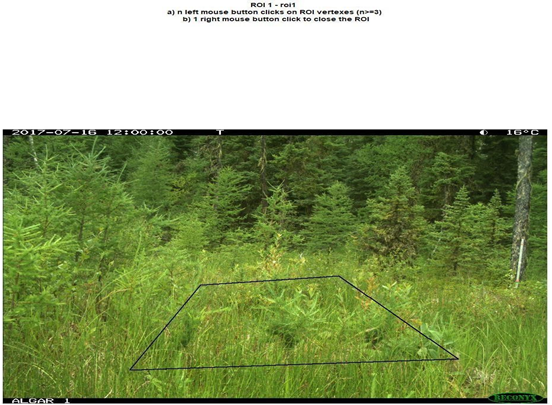
Figure 1. An example of a user-defined “ROI” or region of interest used in the Phenopix analysis.
With one of WildCo’s main study tools being the camera trap, readers of this blog have probably gathered that the use of remote cameras to study the natural world is rapidly increasing in popularity. Remotely-triggered cameras for detecting wildlife have been in use almost as long as the camera has been around: tripwires were paired with cameras in the 1890’s to get animals to “photograph themselves” (O’Connell et al., 2011). And though not quite as storied a practice, remote cameras have been used to capture plants and document landscape change for more than half a century (Alberton et al., 2017). Obviously, these two respective fields have evolved quite a bit since their beginnings. Yet, despite overarching similarities between these zoological and botanical methodologies, and the questions they seek to answer, the twin photographic practices have not often crossed paths.
However, the potential to harness camera trap surveys to collect information on both plant and animal communities is enormous. As the saying goes, “a picture is worth a thousand words,” and in camera trapping, a picture can contain a thousand data points. The photographic captures are a treasure trove of information–modern camera traps can record time, temperature, barometric pressure, location, and everything happening in the frame—but usually much of this information goes unused.
One of the often-overlooked tidbits of information from wildlife cameras is what the plants are doing in the background, rather than what the animals are doing in the foreground. Plants have seasonal life cycles directly linked to climate and weather, and animal life cycles are generally linked to these in turn. Many of the phenomena caused by these cycles within plants are generally quite visible, like germination, budding, flowering, and senescence. However, previously extracting this information from photos was tedious. Now, however, with new automated data extraction tools, this information is much more accessible.
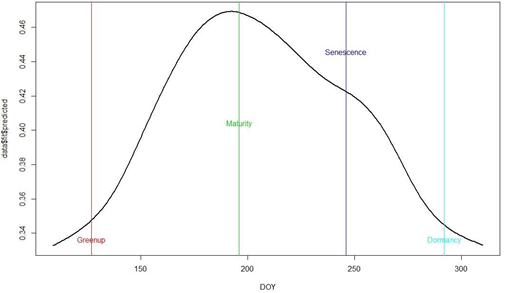
Figure 2. The predicted annual phenological cycle of an example camera trap “region of interest”.
Recently in WildCo, our focus has been centred on extracting annual phenological data from images we’ve taken, using an R package called Phenopix (Filippa et al. 2017). In phenological studies with camera traps, images are taken at least once a day at the same time every day to produce daily time-lapses over time. By then setting a ‘Region of Interest’ (ROI) for our photos within the package, we can look at the growth cycle of a specific type of vegetation, say grass, in the foreground of an image. Phenopix can then extract the colours from the ROI and give us a metric of “greenness” for each day. This can be used as a proxy for the plant’s yearly cycle, from budding through green-up to abscission (loss of leaves in the fall). The package will then fit a curve to those values, analyze it, and label those aforementioned events in the cycle, all while computing the uncertainty in the plotted curve and labeling it using built-in functions. And ‘greenness’ is not the only metric that can be produced- information on any of the primary colours can be extracted, and blue can be used as a proxy for snow cover, potentially allowing for quick extraction of snow cover data!
Understanding the annual phenology of a collection of sites can have useful implications for wildlife ecology and conservation. For long-term camera-trap studies of animals that already take daily time-lapse images, the captured images could also be providing long-term data on phenological responses to climate change. As the climate changes, timing of budding and other events in the plant life cycles may shift, and these observed shifts might act indicators of climate patterns. These phenological data can also be used as covariates in models to assess patterns and drivers of changes in animal distribution and abundance. It may be that connecting these data on plant phenology to animal detections will offer finer-scaled insights into spatiotemporal patterns of habitat selection for the species that form the backbone of our research at WildCo.
As has been discussed in previous blog posts, careful analysis of these animals’ patterns and tendencies can help inform science-based policies to improve wildlife management. When thinking about camera trap surveys, we often think about dramatic photos of charismatic megafauna, but the environment surrounding the animal should not be ignored.
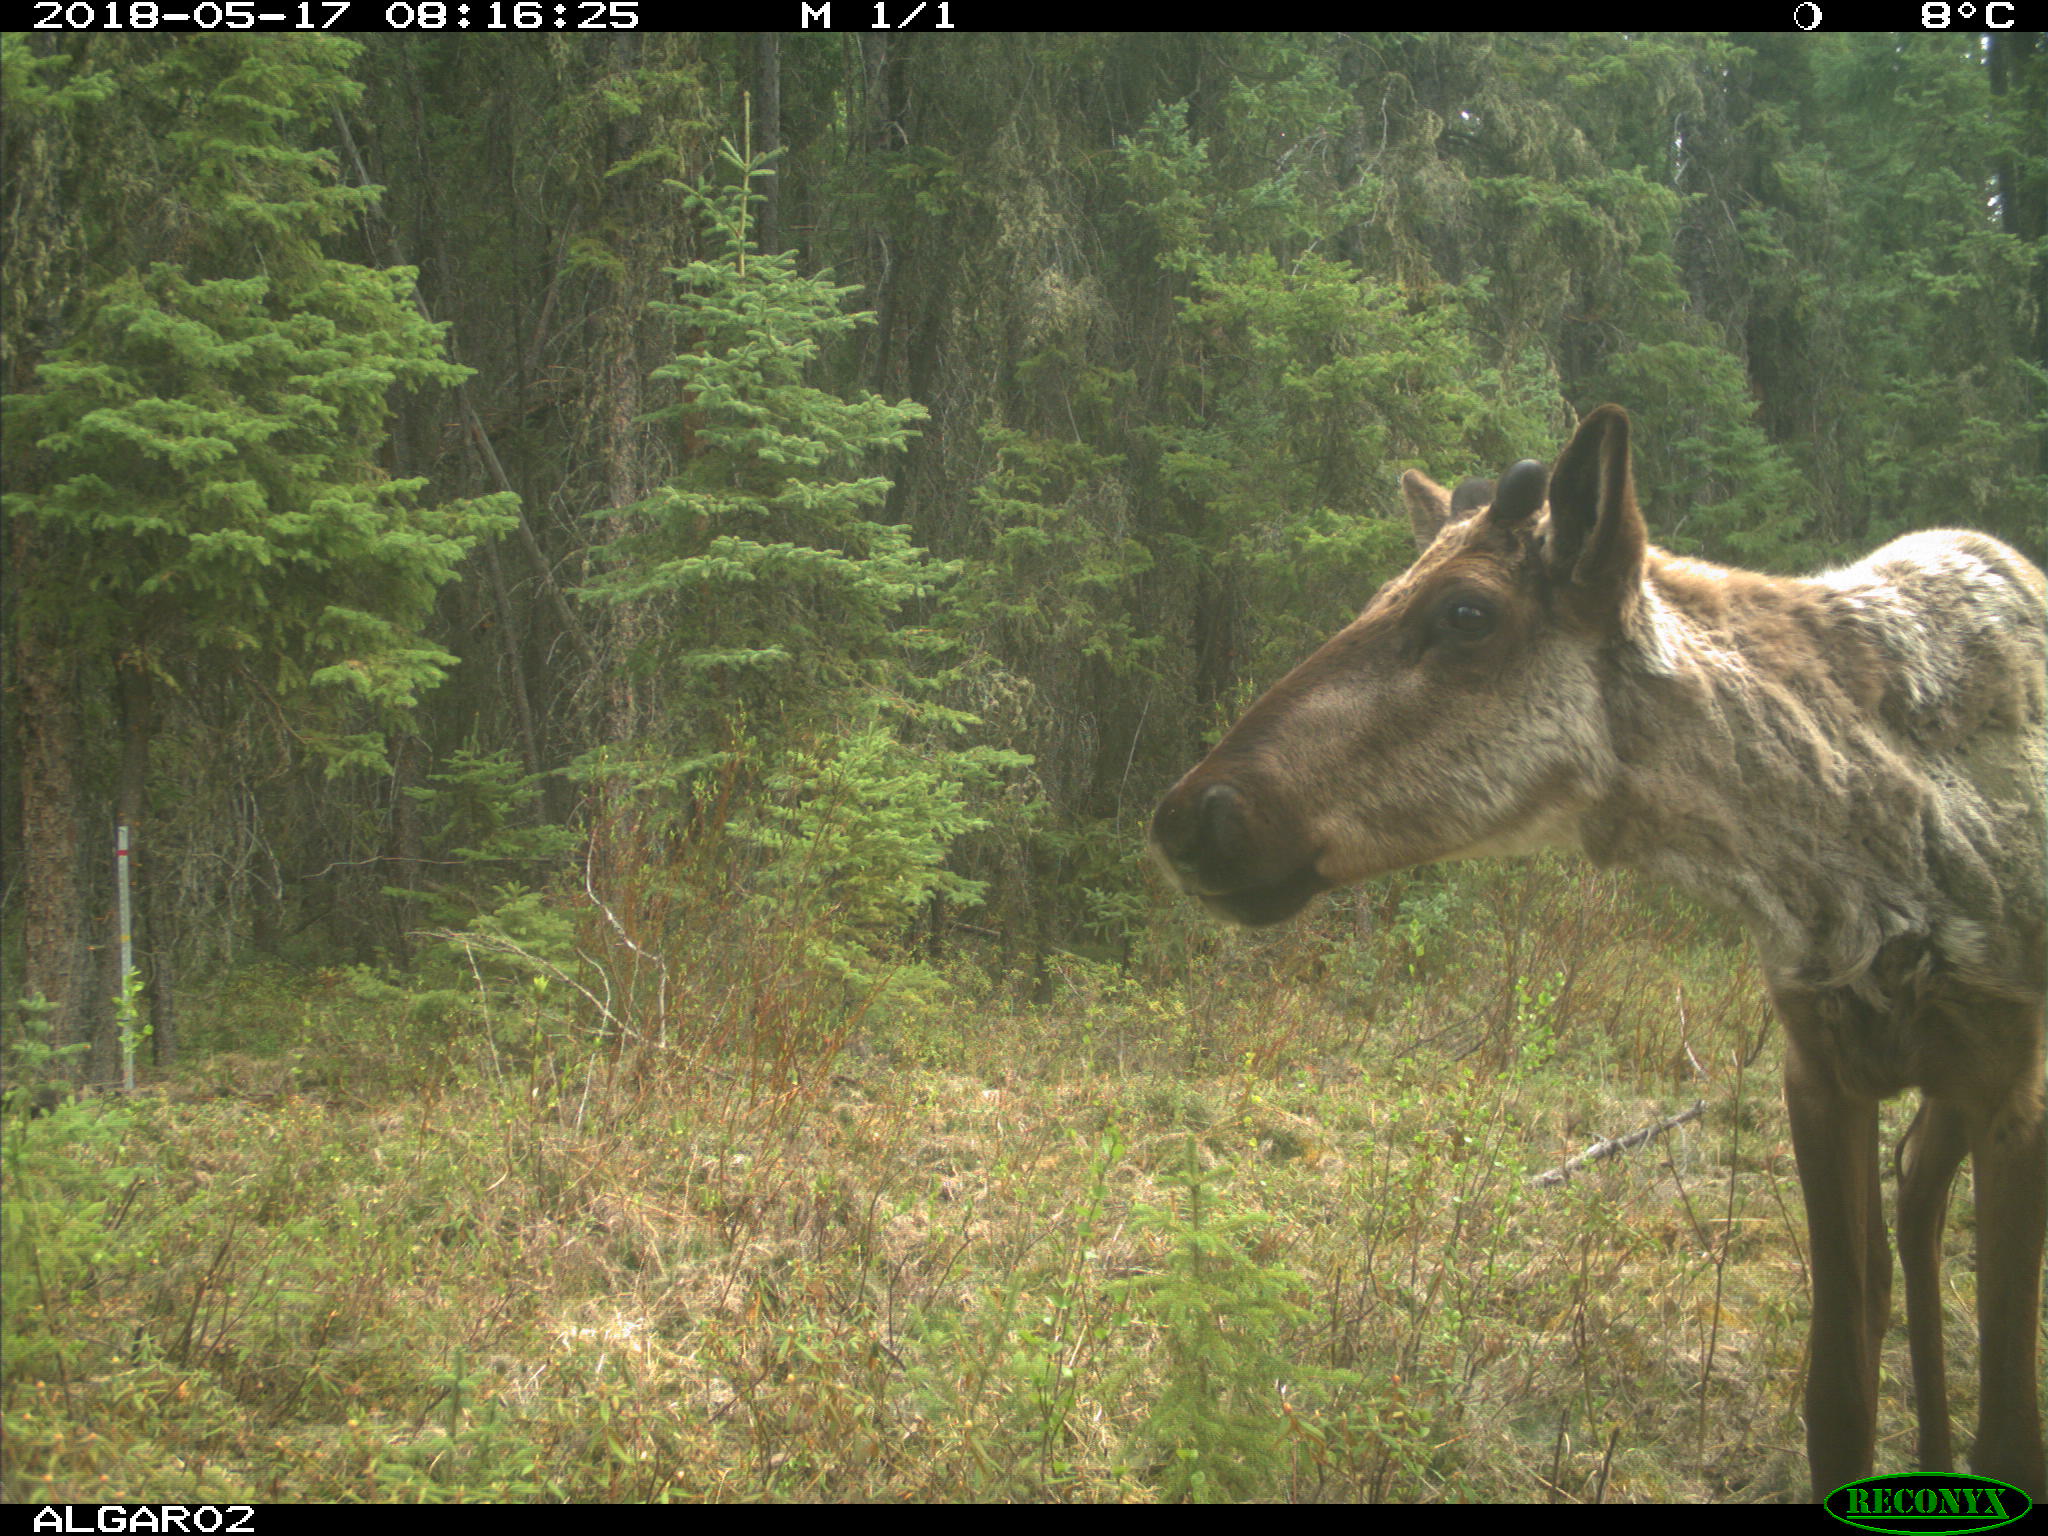
Figure 3. A boreal woodland caribou (Rangifer tarandus caribou) captured on camera. Phenopix may give insights into connections between background phenology/snow cover and species detection rates.
References:
Alberton, B., Torres, R. da S., Cancian, L.F., Borges, B.D., Almeida, J., Mariano, G.C., Santos, J. dos, Morellato, L.P.C., 2017. Introducing digital cameras to monitor plant phenology in the tropics: applications for conservation. Perspect. Ecol. Conserv. 15, 82–90. doi:10.1016/j.pecon.2017.06.004
O’Connell, A.F., Nichols, J.D., Karanth, K.U. (Eds.), 2011. Camera Traps in Animal Ecology: Methods and Analyses. Springer.
Filippa, G., Cremonese, E., Migliavacca, M., Galvagno, M., Folker, M., Richardson, A.D., Tomelleri, E., 2017. phenopix: Process Digital Images of a Vegetation Cover. R package version 2.3.1. https://CRAN.R-project.org/package=phenopix